
CHROMATOGRAPHY / GC
Reading GC Retention Times and Peak Areas
Interpret retention times, integrated detector responses, relative areas, and the evidence needed for compound identification.
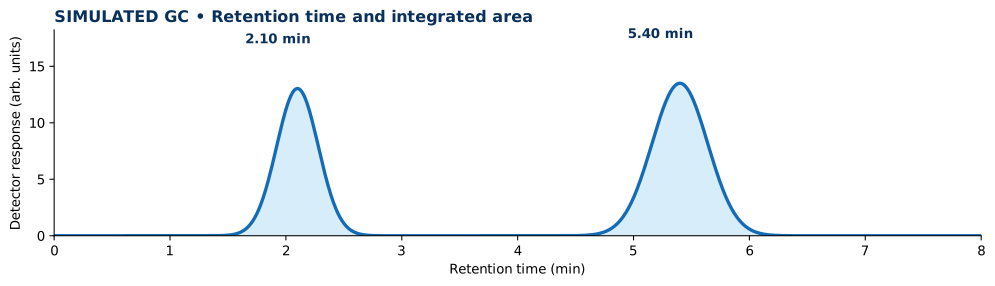
1. Read the chromatogram
A chromatogram plots detector response against time after injection. Retention time (tR) describes where a peak appears under a particular method; area is integrated detector response relative to a chosen baseline.
2. Use standards for identification
Compare retention times of candidate compounds with authentic standards under the SAME column, flow, temperature, and method. Coelution and method-dependent shifts make retention alone insufficient for unique identity.
3. Calculate uncorrected peak-area percentages
Suppose peak A has integrated area 420 and peak B has 580. Area% A = 420/(420+580) × 100 = 42.0%. This means 42% of the included integrated detector area, not automatically 42% of molecules, mass, purity, or yield.
4. Understand detector response
Detectors such as a thermal conductivity detector (TCD) can respond differently to different analytes. Calibrated concentrations require appropriate standards, response factors, integration and baseline checks, and consideration of unidentified or excluded peaks.
5. Validate chromatographic data
Confirm baseline placement, peak integration, potential overlapping peaks, injection reproducibility, detector operation, and replicate consistency before reporting quantitative differences.
Common interpretation mistakes
- Equating uncorrected area % to mol % or mass %.
- Assigning unknown identities by retention time alone.
- Mistaking retention-time separation for chromatographic resolution without considering widths.
Quick concept check
A GC trace has peak areas of 420 and 580. What is the first peak’s area percentage, and what does it mean?
Show answer and reasoning
42.0% of the two integrated detector areas. It does not automatically mean 42.0 mass%, mole%, or chemical purity without validated calibration.