
SPECTROSCOPY / DATA QUALITY
Evaluating IR Spectrum Quality
Recognize when atmosphere, saturation, baseline distortion or poor sample preparation undermine your interpretation.
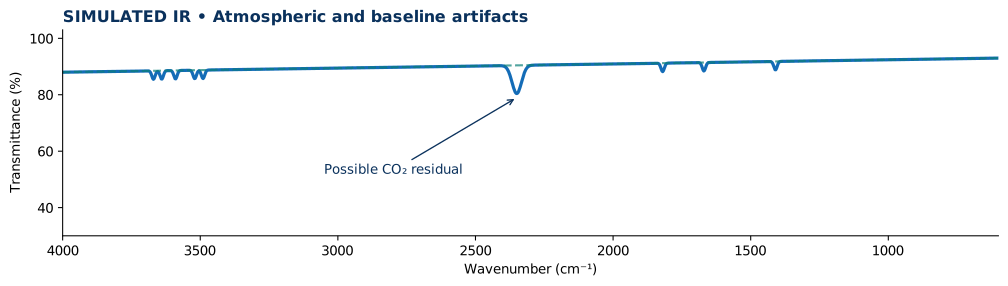
1. Atmospheric interference
Residual atmospheric CO₂ can generate features near 2350 cm⁻¹; differences in water vapor between sample and background may produce narrow features in multiple regions. Check whether artifacts change after collecting a new background.
2. Distinguish sample bands from artifacts
An alcohol O–H is usually broad because of hydrogen bonding; sharp, irregular water-vapor lines are a different pattern. A matching blank or instrument background can help resolve ambiguity.
3. Recognize saturation
A band approaching the minimum transmittance floor may be saturated. Flattened minima and lost intensity information cannot be reconstructed reliably merely by smoothing or baseline correction. Reduce sample loading or path length and reacquire.
4. Baseline and scattering
A drifting or sloping baseline may arise from scattering, poor ATR contact, pellet thickness, or mismatched background. Baseline correction can improve presentation but must be documented and must not replace the original file.
5. Lab-report decision
Keep raw and processed spectra separately. State which observations are limited by data quality, what was changed in processing, and which measurements would require repeating.
Common interpretation mistakes
- Calling every band near 2350 cm⁻¹ a sample nitrile.
- Representing a computationally corrected trace as a newly measured spectrum.
- Assigning intensity or concentration from a saturated peak.
Quick concept check
A new background removes a narrow band near 2350 cm⁻¹. What conclusion is most appropriate?
Show answer and reasoning
The feature was plausibly an atmospheric/background mismatch. Record the before/after comparison instead of treating the original artifact as confirmed sample chemistry.