
SPECTROSCOPY / IR
Interpreting IR Functional-Group Evidence
Read a spectrum from high to low wavenumber, identify useful combinations of absorptions, and state conclusions with appropriate uncertainty.
1. Start with spectrum quality
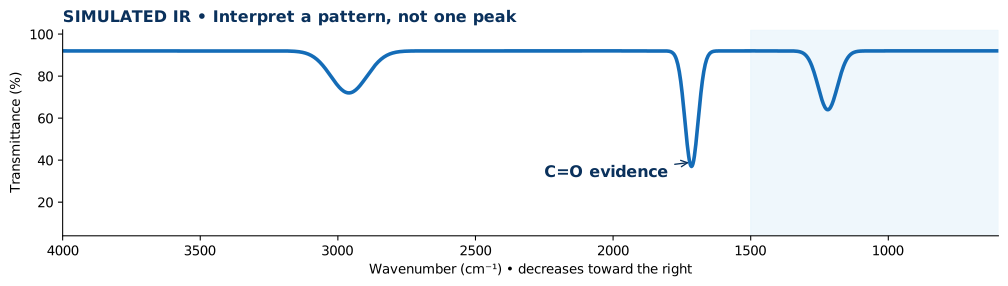
Read the axis first. Standard mid-IR graphs run from approximately 4000 cm⁻¹ at the left to 400–600 cm⁻¹ at the right. In transmittance plots absorptions extend downward; absorbance plots show upward peaks. Confirm an appropriate background, baseline and readable intensity.
2. Look for diagnostic regions
A strong C=O often occurs around 1650–1750 cm⁻¹; broad alcohol O–H commonly appears around 3200–3600 cm⁻¹; very broad carboxylic acid O–H can cover roughly 2500–3300 cm⁻¹. Exact ranges shift with molecular structure, phase, hydrogen bonding and experimental conditions.
3. Compare a pattern of signals
A strong C=O together with a very broad acid O–H is stronger evidence for a carboxylic acid than either alone. A C=O signal alone does not distinguish every aldehyde, ketone, ester, or acid.
4. Worked example
A simulated sample has a strong 1715 cm⁻¹ band and C–H near 2960 cm⁻¹ but no convincing broad O–H. A saturated ketone is consistent with the spectrum. Confirm with an authentic reference and complementary observations before naming one exact compound.
5. Write a defensible conclusion
Describe observed bands and assignments, note absent or ambiguous features, identify at least one alternative explanation, and propose further evidence. Avoid claiming purity or an exact structure from one peak.
Common interpretation mistakes
- Reading transmittance dips as a lack of absorption.
- Treating one IR band as proof of a unique compound.
- Ignoring sample water or background mismatch.
Quick concept check
A strong 1715 cm⁻¹ band is observed with no broad O–H. Does this establish a unique ketone structure?
Show answer and reasoning
No. The band supports C=O, and a ketone may be consistent, but other carbonyl-containing structures and additional data must be considered.