
IR Spectroscopy: Identify Functional Groups
Read wavenumber, bond vibrations, carbonyl and O–H bands; practice identifying functional groups.
Understand the concept
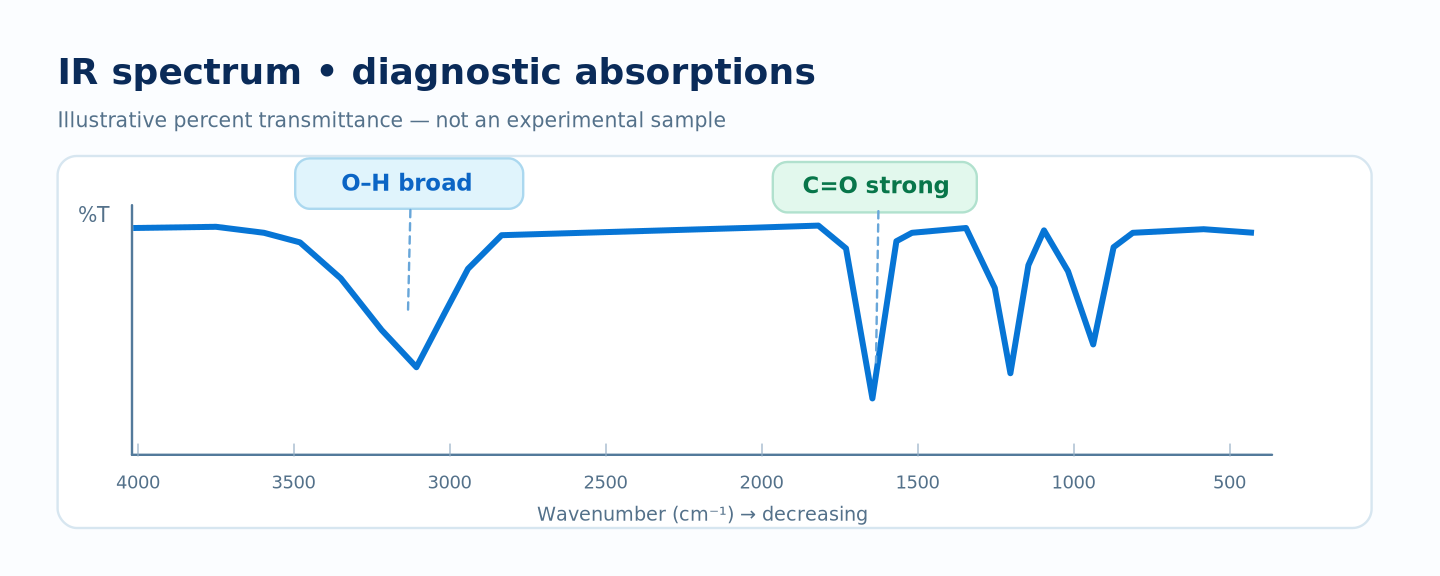
Infrared spectroscopy measures absorption of infrared radiation by molecular vibrations that change a molecule’s dipole moment. A typical IR spectrum shows wavenumber (cm⁻¹) horizontally, usually decreasing from left to right, and either transmittance or absorbance vertically.
A deep downward band on a percent transmittance plot indicates strong absorption; the same feature rises upward on an absorbance plot.
A reliable four-step approach
- Check for a broad O–H absorption in the high-wavenumber region.
- Look for a strong carbonyl band near 1700 cm⁻¹; its position varies with structure.
- Check for diagnostic signals such as C≡N near 2250 cm⁻¹.
- Use the fingerprint region as supporting evidence, not a single definitive match.
Visual explanation
Work through the examples
An unknown has an intense band near 1715 cm⁻¹ and lacks a broad O–H band.
A band in this region is consistent with C=O stretching. Without an O–H band, a simple ketone or aldehyde may be possible; inspect the fingerprint region and any aldehydic C–H bands.
Result: It is consistent with a carbonyl compound, not enough information for a unique identity.
An unknown has a very broad absorption from roughly 2500–3300 cm⁻¹ and a C=O peak.
Carboxylic acid O–H stretches can be unusually broad and extend below 3000 cm⁻¹. Combined with a carbonyl peak, this supports a carboxylic acid.
Result: The combination strongly supports a carboxylic acid.
Common mistakes
- Mistaking downward IR transmittance peaks for lack of absorption.
- Assigning a functional group from a single ambiguous peak.
- Treating 1500 cm⁻¹ and lower as useless instead of useful supporting evidence.
Check your understanding
An IR transmittance spectrum has a broad band at 3300 cm⁻¹ and no carbonyl peak. What might the broad band indicate?
Alcohol O–H stretching commonly produces a broad absorption around 3200–3600 cm⁻¹.
Complete the interactive practice below to check more questions and review explanations.
Interactive Practice
Answer curated questions, then review the scientific explanation.
Loading practice questions…