
INTOCHEMISTRY / INSTRUMENTAL ANALYSIS
Spectrophotometry and Calibration Curves
Use the slope and intercept of a linear calibration to calculate sample concentration and amount.
Rearrange A = mc + b, account for a fitted nonzero intercept, and assess when a concentration is within the calibrated range.
1. What the instrument measures
A spectrophotometer measures absorbance. In an appropriate linear working range at a fixed wavelength, a fitted calibration can connect absorbance A with analyte concentration c: A = mc + b. The fitted intercept b need not be zero.
2. Solve for concentration
Subtract the fitted intercept from sample absorbance, then divide by the slope: c = (A − b)/m. Check the units on the slope. A sample beyond the validated calibration range should be diluted and remeasured rather than extrapolated blindly.
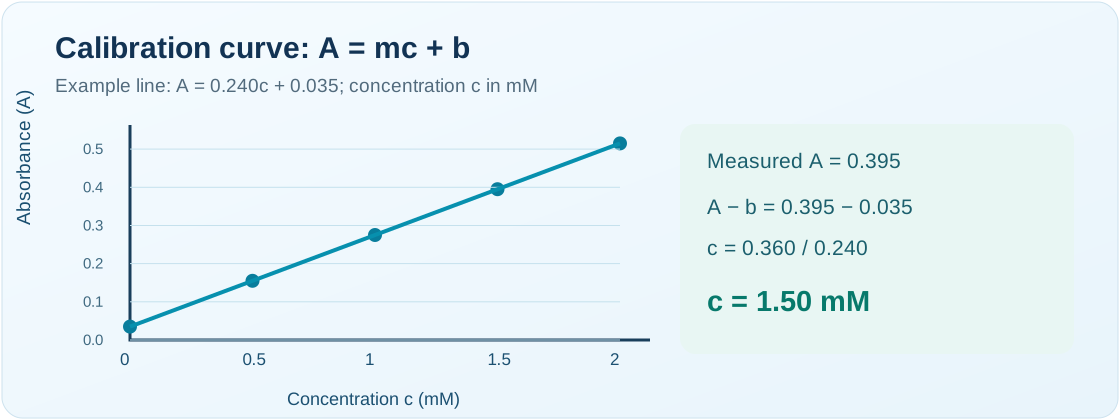
3. Worked example
For A = 0.240c + 0.035 with c in mM, a sample absorbance of 0.395 gives c = (0.395 − 0.035)/0.240 = 1.50 mM. In 15.0 mL of sample, amount = 1.50 mM × 15.0 mL = 22.5 µmol.
4. Quality checks
Use the same blank and wavelength conditions as the standards. Inspect whether standard points are reasonably linear and whether the sample falls within the range. Replicates, uncertainty, appropriate blanking and matrix effects matter for actual laboratory results.
Quick concept check
For A = 0.200c + 0.020, and A = 0.320, find c in mM.
Show worked answer
c = (0.320 − 0.020)/0.200 = 1.50 mM.