
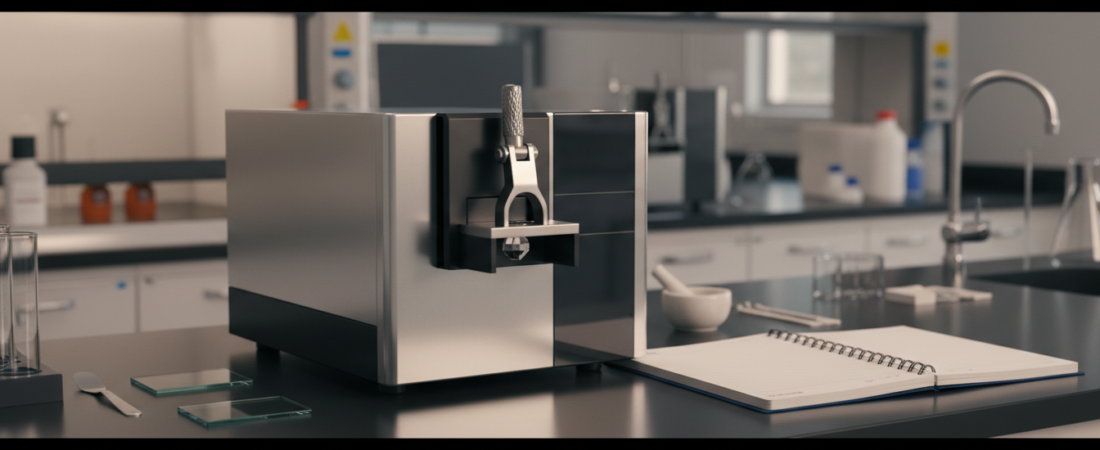
Imagine receiving an unknown organic liquid and its infrared spectrum. Could you tell whether it is an alcohol, ketone, ester, or carboxylic acid? With a systematic approach, you can often narrow down the possible functional groups in minutes. The secret is not memorizing hundreds of peak positions: it is learning which combinations of spectral features can—or cannot—support a conclusion.
This college organic chemistry guide explains the wavenumber axis, high-value IR absorption regions, sample preparation effects, and a practical five-step identification process. It also includes a complete unknown-compound example and practice scenarios with explanations.
What infrared spectroscopy can tell you
Molecules absorb infrared radiation when vibrational motions interact appropriately with the oscillating electric field. A vibration must involve a change in dipole moment to be IR-active. Stretching and bending modes therefore produce a set of absorption bands related to bond strengths, atomic masses, and molecular environment.
IR spectroscopy is excellent for identifying functional-group evidence. It is usually not sufficient by itself to determine the complete connectivity, stereochemistry, or identity of an unknown compound. A confident identification may require molecular formula data, NMR, mass spectrometry, comparisons with authentic reference spectra, or other experiments.
1. Read the axes correctly
Most organic IR plots show wavenumber in cm−1 across the horizontal axis, conventionally decreasing from about 4000 on the left to 400 on the right. Higher wavenumber means higher photon energy. Do not read the chart as if wavenumber increased left to right.
The vertical axis is often percent transmittance, so an absorption appears as a downward dip. In an absorbance plot, a strong absorption instead appears as an upward peak. Confirm which scale you’re using before deciding that “higher means stronger.”
Broad bands can be chemically informative. The shape, position, and intensity of a feature may matter as much as its exact maximum. A small shoulder or weak band should not outweigh a clearly absent diagnostic feature.
2. The functional-group bands worth learning first
| Approximate position (cm−1) | Common interpretation | Clue to check |
|---|---|---|
| 3200–3600 | Alcohol/phenol O–H stretch | Often broad when hydrogen bonded |
| 2500–3300 | Carboxylic acid O–H stretch | Extremely broad, commonly with a C=O band |
| 3300–3500 | N–H stretch | Often narrower than hydrogen-bonded O–H |
| ≈3300 | Terminal alkyne ≡C–H | Usually relatively sharp |
| 3000–3100 | sp2 C–H stretch | Often alkene or aromatic C–H |
| 2850–2960 | sp3 C–H stretch | Typical of alkyl groups |
| 2210–2260 | C≡N stretch | Relatively sharp nitrile feature |
| ≈2100–2260 | C≡C stretch | May be weak or absent for some internal alkynes |
| ≈1650–1800 | C=O stretch | Strong in many carbonyl compounds |
| ≈1000–1300 | C–O stretching region | Useful with alcohol, ether, and ester evidence |
Memorizing an exact “ketone peak” at 1715 cm−1 is less useful than understanding why many saturated, unconjugated acyclic ketones absorb near that region, and why other carbonyl compounds may overlap.
3. The five-pass method for an unknown spectrum
Pass 1 — Check the spectrum’s quality
Before assigning functional groups, inspect the baseline, scan range, resolution, and sample preparation. Atmospheric water vapor and carbon dioxide can introduce artifacts, and poor contact with an ATR crystal can distort intensities. Saturation, scattering, contaminated crystals, residual solvent, and inadequate background subtraction also create misleading features.
Never remove a questionable feature just because it disrupts your proposed answer. Recollect an appropriate background, clean or reprepare the sample, compare replicate runs, and document the problem. A modified spectrum is not a substitute for reporting data quality.
Pass 2 — Investigate 3600–2500 cm−1
Look for a broad O–H feature, one or more N–H bands, sharp terminal-alkyne C–H absorption around 3300, and the distribution of C–H signals above and below 3000. A very broad feature spanning roughly 2500–3300 cm−1 may indicate a carboxylic acid—particularly when a strong carbonyl band also appears.
Pass 3 — Inspect 2300–2000 cm−1
A notable absorption near 2210–2260 cm−1 can support a nitrile assignment. Carbon–carbon triple-bond stretching also falls in this region, but intensity varies and symmetric internal alkynes may show weak or absent features. Check for a terminal alkyne ≡C–H signal near 3300 when relevant.
Be particularly cautious near the approximate 2350 cm−1 atmospheric CO2 region. An artifact can look like a genuine sample feature, especially if the background and sample atmosphere differ.
Pass 4 — Identify the carbonyl region around 1800–1650 cm−1
A strong C=O absorption can signal a ketone, aldehyde, ester, carboxylic acid, amide, anhydride, or another carbonyl-containing class. These groups overlap. Often-useful approximate positions for unconjugated examples include ketones around 1715 cm−1, esters around 1735–1750 cm−1, and many amides at lower frequencies due to resonance effects.
Use supporting evidence: an aldehyde may show characteristic weak C–H features around 2720 and 2820 cm−1; an ester commonly has prominent C–O bands; a carboxylic acid may display the wide acid O–H envelope. Conjugation often lowers a carbonyl stretching frequency; ring strain and structural effects can shift it in other directions.
Pass 5 — Use the fingerprint region and outside information
Below approximately 1500 cm−1, many vibrations overlap. The fingerprint region is excellent for comparing a measured spectrum against a genuine reference spectrum under comparable conditions, but it’s rarely efficient to assign every band by eye. Combine characteristic features with molecular formula, degrees of unsaturation, and other spectroscopic evidence.
4. Worked unknown: distinguish an ester from a carboxylic acid
Scenario: An unknown sample has the molecular formula C4H8O2. Its IR spectrum shows a strong carbonyl absorption near 1740 cm−1, prominent bands in the 1000–1300 cm−1 C–O region, and no clearly visible extremely broad acid O–H envelope from 2500–3300 cm−1. What functional-group class is most consistent with the evidence?
Step 1: calculate the degree of unsaturation
For a neutral molecular formula containing carbon, hydrogen, oxygen, nitrogen, and halogens, the customary degree-of-unsaturation formula is DBE = (2C + 2 + N − H − X)/2, with X representing halogens; oxygen and sulfur do not enter the expression. Here, DBE = (2×4 + 2 − 8)/2 = 1. The formula is consistent with one carbonyl and no additional rings or π bonds.
Step 2: assemble the positive and negative evidence
The strong C=O band supports a carbonyl group. The prominent C–O bands are compatible with an ester. The absence of the characteristic very broad O–H feature argues against a typical carboxylic acid under ordinary sample conditions. Taken together, these findings support an ester as a strong candidate.
Step 3: do not overclaim the structure
C4H8O2 has multiple possible ester structures, including ethyl acetate and methyl propionate. IR alone cannot confidently distinguish every constitutional isomer. A reference-spectrum comparison and other data such as 1H NMR would be needed for a stronger identification.
5. ATR-IR versus transmission IR: why spectra may differ
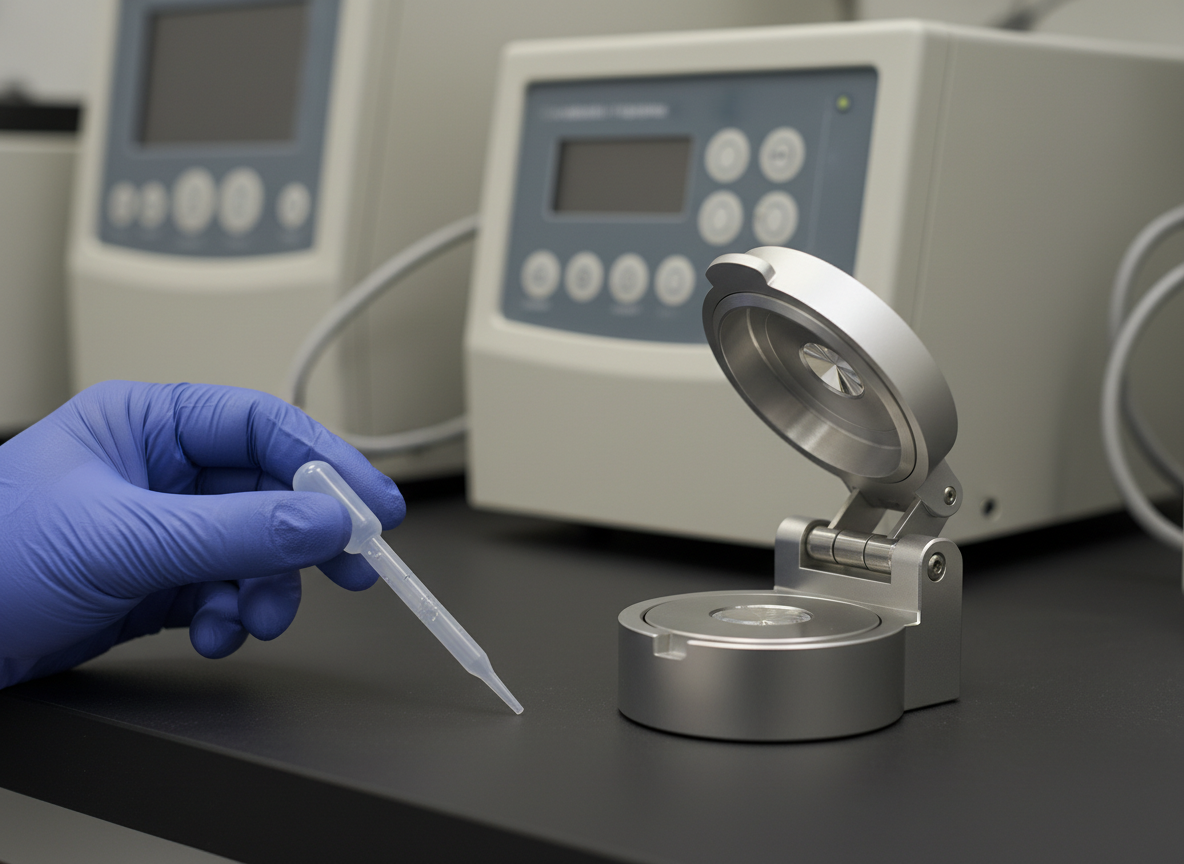
An ATR-IR accessory measures absorption through an evanescent field interacting with a thin region of the sample at the internal reflection surface. Proper, reproducible contact and cleanliness are essential. Transmission methods place radiation through a liquid film, salt plates, gas cell, or pellet; sample thickness and concentration influence band intensity and saturation.
Do not assume an ATR spectrum and a transmission spectrum will have identical relative intensities or exactly identical band shapes. Check instrument processing, atmospheric correction, resolution, and sample state. In a teaching laboratory, retain raw data and clearly label any corrected or baseline-treated spectrum.
6. Which band combinations are most convincing?
| Observed pattern | Useful first hypothesis | Important limitation |
|---|---|---|
| Strong ≈1715 cm−1; no broad O–H | Ketone or another carbonyl class | Aldehydes and other carbonyls can overlap |
| Very broad 2500–3300 plus strong C=O | Carboxylic acid | Moisture, sample state and mixtures need consideration |
| Sharp ≈2240 cm−1 | Nitrile-containing compound | Check artifacts and possible triple-bond alternatives |
| Broad O–H plus C–O, without carbonyl | Alcohol or phenol | Distinguish from water contamination or other O–H species |
7. Practice: interpret four mini-spectra
Unknown A: A clear strong absorption appears at 1715 cm−1, without an obvious broad O–H band. The sample is known to be a simple, neutral organic compound. What class is a reasonable first candidate, and what should you check next?
Unknown B: An unusually broad feature extends across 2500–3300 cm−1, and a strong band lies near 1710 cm−1. Which functional-group class is strongly suggested?
Unknown C: A fairly sharp absorption occurs near 2240 cm−1, with no clear carbonyl absorption. What bond type is a leading interpretation?
Unknown D: A broad band occurs in the low- to mid-3300 cm−1 range, along with a strong C–O-region absorption near 1050 cm−1; no obvious C=O is observed. What is a good provisional interpretation?
Practice answers and reasons
A: A ketone is a plausible first candidate. Check for aldehyde C–H features and other carbonyl-class clues; the single peak does not establish a ketone uniquely.
B: A carboxylic acid is strongly suggested by the broad acid O–H envelope together with a carbonyl.
C: A C≡N stretch (nitrile) is a leading candidate. Evaluate band shape, sample background and other evidence before reporting an identification.
D: An alcohol is a reasonable candidate from O–H and C–O absorptions without a carbonyl. Consider whether water, a phenol, or another contaminant could also contribute.
Interpret an IR spectrum like a detective: combine multiple clues, challenge your first hypothesis, and explain what the data cannot prove.
8. Explore real spectra instead of fabricated examples
For authentic reference spectra, use the NIST Chemistry WebBook. Try comparing ethanol, acetone, ethyl acetate, and acetic acid, paying attention to whether the reference is gas phase, condensed phase, ATR, or another method. For a broader teaching reference, consult the Chemistry LibreTexts IR absorption table and its organic chemistry interpretation guide.
Interested in a surprising application beyond the lab? Explore our article on how astronomers detect molecules using spectroscopy. To connect spectroscopy with hands-on chemistry, read our organic chemistry guide to caffeine extraction.