
A mass spectrum can look like a forest of vertical lines until you know what to ask. Which peak tells you the molecular mass? Why is the tallest peak sometimes not the molecular ion? And why do chlorine and bromine give distinctive pairs of peaks two mass units apart?
This original tutorial focuses on electron-ionization (EI) mass spectrometry, the type commonly introduced in organic chemistry and used with GC–MS. We will use a repeatable five-step interpretation method, then work through five molecules. All teaching diagrams and example peak tables below are schematic rather than reproductions of published NIST spectra; referenced compound formulas and chemical principles are documented in the sources.
1. Learn the three labels that matter most
| Term | What it means | What to look for |
|---|---|---|
| m/z | Mass-to-charge coordinate of a detected ion, conventionally reported on the x-axis. | For a singly charged ion in a low-resolution organic EI spectrum, a nominal m/z commonly resembles its integer mass. |
| Base peak | The spectrum’s most intense peak, assigned 100% relative intensity. | The tallest line; it may be a fragment. |
| Molecular ion (M+•) | Ion formed from a molecule by removing an electron without breaking its original atomic connectivity. | A candidate at the mass of the unfragmented molecule; it can be small or even undetectable. |
These definitions follow the IUPAC terminology for m/z, base peak, and molecular ion. In an EI spectrum, a high-energy electron can knock an electron out of a neutral molecule, producing a positively charged odd-electron ion:
M + e− → M+• + 2 e−
That molecular ion may fragment into smaller positively charged ions and neutral species. The mass spectrometer detects charged ions, not the neutral fragments. Peak heights reflect ion production and detection under the measurement conditions; they do not count how many atoms of each element the molecule contains.
2. A five-step reading method
- Confirm the ionization method. EI spectra can contain a molecular radical cation M+•; electrospray ionization (ESI) often gives ions such as [M+H]+. Do not automatically use the same peak assignment for both methods.
- Find the base peak. This is the ion with 100% relative intensity. Record its m/z, but do not yet call it the molecular mass.
- Look for a plausible molecular-ion region. Inspect high-m/z peaks and nearby isotope partners. The highest visible line is not always M+•; the molecular ion may be weak, absent, or accompanied by isotope peaks.
- Calculate nominal mass differences. Subtract a fragment’s m/z from a proposed molecular-ion m/z. A difference of 15 may suggest loss of CH3•, for example; investigate whether a reasonable ion structure results.
- Check isotope patterns and chemical consistency. Evaluate M, M+1, M+2 and possible M+4 clusters, charge state, valence, and the structure you propose. Confirm with complementary evidence rather than identifying an unknown from one peak alone.
3. Worked example: acetone shows why the base peak is not always M
Acetone is CH3–C(=O)–CH3, with formula C3H6O and nominal molecular mass 58. In a typical EI spectrum, an important fragment appears at m/z 43, corresponding to the acylium ion CH3CO+. The molecular ion appears at m/z 58 and can be less intense than that fragment.
Bar heights illustrate the distinction between molecular-ion and fragment peaks, not NIST peak intensities.
The difference 58 − 43 = 15 is consistent with loss of a methyl radical (CH3•) from the molecular radical cation, producing a resonance-stabilized acylium fragment. This is a useful fragment assignment, not a license to assume that every 15-unit difference is the same process. Compare the compound with the NIST Chemistry WebBook acetone EI data.
4. Worked example: toluene and a stable m/z 91 fragment
Toluene (C7H8) has nominal mass 92. Electron ionization can give M+• at m/z 92 and a particularly important fragment at m/z 91, C7H7+. This cation can be represented by benzyl-related and tropylium-like resonance/rearrangement descriptions.
The mass difference is just 1, corresponding to loss of a hydrogen atom in a plausible fragmentation route. The teaching point is that a very strong m/z 91 line does not imply a molecular mass of 91. Structural context and the molecular-ion region matter. Check the NIST toluene reference.
5. Worked example: one chlorine makes a 3:1 M and M+2 pair
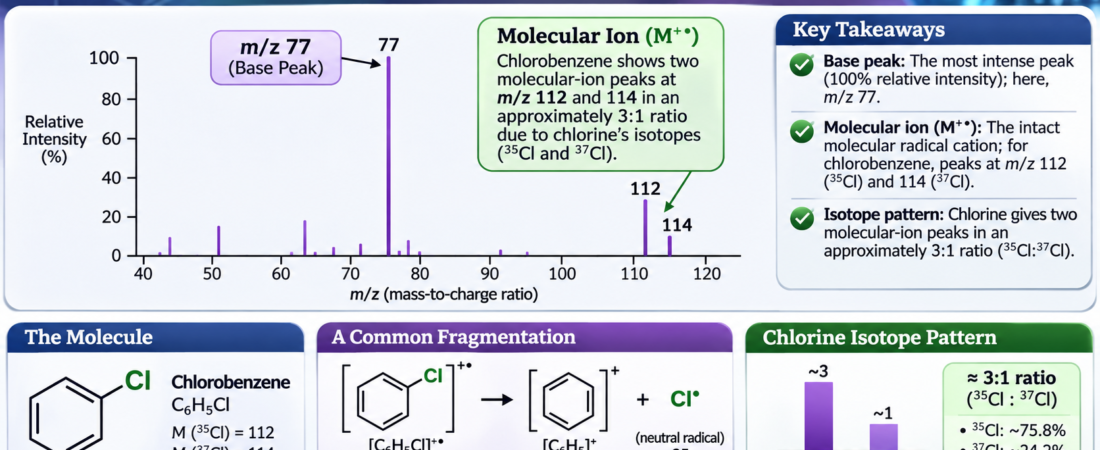
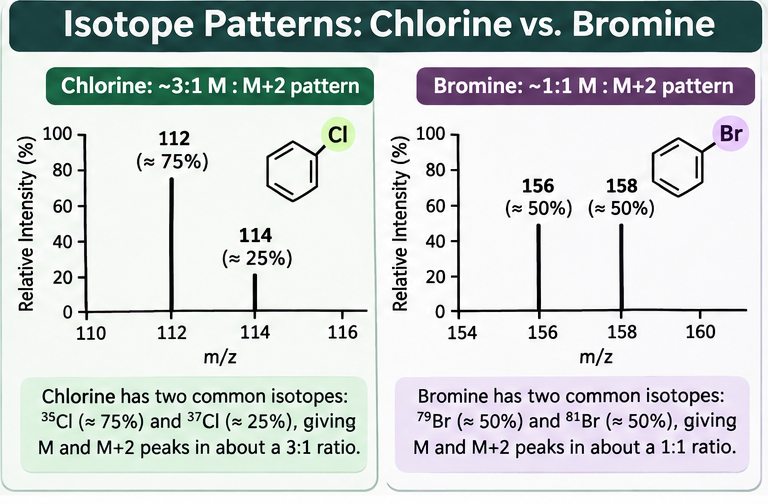
Natural chlorine contains approximately 75.77% 35Cl and 24.23% 37Cl according to NIST isotope data. Chlorine-containing molecular ions therefore often produce an M peak and an M+2 peak in a ratio near 3:1 when there is one chlorine atom and other isotopic contributions are small.
Take chlorobenzene, C6H5Cl. Using nominal masses 12 for carbon, 1 for hydrogen, and 35 or 37 for chlorine:
- With 35Cl: (6 × 12) + (5 × 1) + 35 = m/z 112.
- With 37Cl: (6 × 12) + (5 × 1) + 37 = m/z 114.
Approximate relative proportions 3:1; modeled from naturally occurring chlorine isotope abundance, not copied from a measured spectrum.
Be careful with the term molecular weight: the average molar mass of chlorobenzene is around 112.56 g/mol, while its principal nominal isotope peaks are 112 and 114. The average is not supposed to equal the integer position of either isotope peak. See the NIST chlorobenzene record.
6. Worked example: one bromine makes an approximately 1:1 pair
Bromine’s two principal naturally occurring isotopes are present in nearly equal amounts: 79Br ≈ 50.69% and 81Br ≈ 49.31%. That makes a single bromine atom an especially recognizable isotope signature. NIST reports the isotope abundances.
For bromobenzene, C6H5Br, the nominal molecular-ion pair is:
- 79Br isotopologue: 72 + 5 + 79 = m/z 156.
- 81Br isotopologue: 72 + 5 + 81 = m/z 158.
Approximate relative proportions 1:1; modeled from natural isotope abundance. Individual full spectra contain other ions and fragments.
The average molar mass is close to 157.01 g/mol, but the prominent nominal ion masses are 156 and 158, not 157. Compare the NIST bromobenzene record.
7. Worked example: two chlorines produce three isotope peaks
Now consider dichloromethane, CH2Cl2. Two chlorine atoms yield three possible numbers of 37Cl atoms: zero, one, or two. The corresponding nominal molecular-ion masses are 84, 86, and 88.
Using a simple binomial model with 35Cl probability ≈ 0.75 and 37Cl probability ≈ 0.25:
| Isotope combination | Nominal m/z | Model probability | Relative ratio |
|---|---|---|---|
| 35Cl + 35Cl | 84 | (0.75)2 = 0.5625 | 9 |
| One 35Cl and one 37Cl | 86 | 2(0.75)(0.25) = 0.3750 | 6 |
| 37Cl + 37Cl | 88 | (0.25)2 = 0.0625 | 1 |
The memorable approximation is 9:6:1 for M:M+2:M+4. The actual molecular-ion cluster contains small contributions from isotopes of other elements, and fragmentation peaks elsewhere in the spectrum do not necessarily follow the same ratios. A two-bromine molecule similarly gives approximately 1:2:1 for its principal bromine isotope combinations.
8. Five common mistakes—and how to avoid them
- Calling the base peak the molecular ion. Acetone and toluene show why fragments can dominate.
- Using average atomic weights for nominal isotope-peak positions. Chlorobenzene’s characteristic pair is at 112 and 114, even though its average molar mass is about 112.56 g/mol.
- Assuming the last visible peak must be M. Isotope peaks and ion adducts can lie above the monoisotopic ion, and weak molecular ions can be missed.
- Treating every 2-unit difference as chlorine or bromine. Compare the ratio, region of the spectrum, and fragment chemistry rather than spacing alone.
- Mixing EI and electrospray rules. A protonated molecule [M+H]+ differs from an EI molecular radical cation M+•. Check the source of the spectrum first.
9. Self-check: read the patterns
These questions use constructed nominal masses and idealized isotope patterns for learning. They do not claim to reproduce instrument output.
A. An EI spectrum has a strong fragment at m/z 43 and an M+• candidate at m/z 58. What is the mass difference, and which worked example does this resemble?
Reveal A
58 − 43 = 15; this resembles acetone, where a CH3CO+ fragment at 43 is important.
B. Molecular-ion-region peaks at 112 and 114 occur near 3:1. What atom is strongly suggested?
Reveal B
One chlorine atom, because 35Cl and 37Cl occur naturally near 3:1.
C. Peaks at 156 and 158 are approximately equal. What atom is strongly suggested?
Reveal C
One bromine atom, provided these are the matching molecular-ion-region isotope peaks.
D. A cluster at m/z 84, 86, and 88 follows roughly 9:6:1. What is a likely halogen count?
Reveal D
Two chlorine atoms in a singly charged ion cluster, as illustrated by CH2Cl2.
E. A candidate M+• appears at 92 but the base peak is 91. Does that contradict a molecular mass of 92?
Reveal E
No. A stable fragment can be more abundant than the molecular ion; toluene is a classic example.
10. What mass spectrometry can—and cannot—prove
Mass spectra offer powerful evidence about ionic mass, isotope composition, and fragment stability. Yet different structures can produce some of the same major fragments. EI spectra should be interpreted together with molecular formulas, expected functional groups, and when available IR, NMR, and chromatographic context. A gas chromatograph separates components over time; the mass spectrometer then analyzes the ions produced from material entering its source.
For more practice, use IntoChemistry’s Spectra Practice Lab: IR, NMR & Mass Spectrometry, the Organic Chemistry I Chapter Guide, and the step-by-step IR tutorial.
Frequently asked questions
Is the molecular-ion peak always the highest-mass peak?
No. Isotope variants can appear at higher m/z, adducts may be formed by some ionization methods, and the original molecular ion may be weak or absent.
Why is the base peak labeled 100%?
Relative intensities are commonly normalized so the strongest ion signal is 100%; smaller peaks are reported relative to it. That is not the percent by mass of the sample.
Can two different molecules have a peak at m/z 43?
Yes. A nominal m/z value alone does not uniquely identify an ion’s elemental composition, structural arrangement, or source molecule. Fragment patterns and other measurements help distinguish possibilities.
Sources and reference data
- International Union of Pure and Applied Chemistry (IUPAC), Gold Book: m/z, Base Peak, and Molecular Ion. Foundational definitions.
- National Institute of Standards and Technology (NIST), Atomic Data for Chlorine and Atomic Data for Bromine. Isotope masses and natural abundances.
- NIST Chemistry WebBook (SRD 69): Acetone, EI Mass Spectrum; Toluene; Chlorobenzene; Bromobenzene. Compound identity and reference spectra.
Scientific and originality note: All teaching text, worked assignments, and schematic diagrams in this article were composed for IntoChemistry. Schematic bar heights are illustrative, not copied from NIST and not claimed to be measured peak intensities. For real unknowns, consult the cited reference spectra and validate analytical conditions. © 2026 IntoChemistry LLC.