
INTOCHEMISTRY / ORGANIC CHEMISTRY LAB / TLC TROUBLESHOOTING
Your TLC plate doesn’t have to look perfect to tell you something useful. But a streak at the baseline, two spots that overlap, or a disappearing solvent front can make a good reaction look like a bad one. The first step is to separate what you observed from what you think caused it.
Below are seven common TLC problems, the chemistry behind them, and specific fixes. The emphasis is on normal-phase silica TLC, the common format used in undergraduate organic chemistry laboratories.
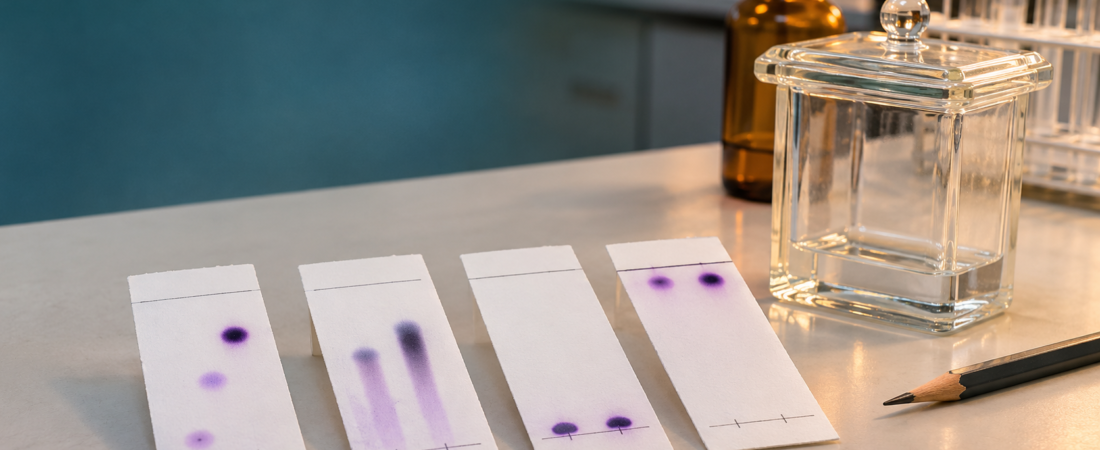
What does a troublesome TLC plate look like?
In normal-phase TLC, polar silica gel serves as the stationary phase. A mobile-phase solvent climbs the plate by capillary action while sample components distribute differently between the silica surface and the moving solvent. More strongly adsorbed components often travel a shorter distance under a given set of conditions. Comparing those distances yields the retention factor, Rf. [1] [5]
Interpret the pattern before selecting a remedy. For example, an elongated spot might mean too much material was deposited; it can also reflect a difficult sample solvent, strong adsorption, or chemical instability. A controlled repeat is more informative than guessing. [2] [3]
Quick TLC troubleshooting table
| What you see | Likely causes to consider | Best first troubleshooting action |
|---|---|---|
| Long streak or large blob | Overloaded spot; insufficient drying; high-boiling solvent or instability | Dilute the sample; apply a small, dry spot and run a fresh plate |
| Spot stays at origin (Rf near 0) | Eluent too weak for this analyte; strong silica interaction | On silica, cautiously increase mobile-phase eluting strength (often polarity) |
| Everything at top (Rf near 1) | Eluent too strong to retain the compounds | On silica, try a less strongly eluting solvent mixture |
| Origin dissolves into solvent pool | Starting baseline submerged | Lower solvent level; keep origin above liquid surface |
| Crooked / irregular solvent front | Plate tilted, chamber moved, splashing or poor equilibration | Level and cover chamber; remake and run plate if badly distorted |
| Cannot calculate trustworthy Rf | Front not marked; baseline wrong; measurements to edge of spot | Mark front immediately; measure from baseline to spot center |
| Plate appears blank | Compound not visible under selected UV method; too little material | Use an appropriate approved visualization method and reference lane |
1. Your TLC spots are streaking or smearing
What you observe: Instead of compact circular spots, the plate displays a tail, vertical purple/brown smear, or broad overlapping band. This often makes it difficult to count mixture components or identify a product.
Why it can happen: Overloading the silica with too much sample is common. The stationary phase cannot give the analyte a sharp distribution when it is applied in a large, concentrated zone. Inadequate drying between spotting applications can also produce a large initial band. A high-boiling spotting solvent (such as DMF or DMSO) may interfere, while strongly interacting or silica-sensitive compounds can streak for other reasons. [2] [3]
Prepare a dilution of the original solution and spot a smaller amount on a new plate. Let each application dry before making another. Keep the original sample and solvent mixture documented so you can compare results. If the dilute spot still streaks, investigate the spotting solvent, analyte stability, and alternate TLC solvent systems.
Do not overinterpret: a streak does not prove decomposition. The University of Rochester recommends considering several competing explanations before concluding the compound is breaking down. [3]
2. The sample stays at the baseline (Rf ≈ 0)
What you observe: The solvent climbs the plate normally, but one or more compounds remain close to their original spotting positions.
Why it can happen: On silica gel, strongly adsorbing polar compounds may remain bound to the stationary phase when the chosen mobile phase is too weak. With common hexanes/ethyl acetate mixtures, adding ethyl acetate generally increases solvent strength and tends to raise Rf values for many analytes. It is a trend, not a guaranteed response for every chemical. Highly ionic or strongly acidic/basic molecules may require a more appropriate stationary/mobile-phase system or carefully selected additives under instructor guidance. [3] [5]
If you are using a typical normal-phase silica plate and a hexanes/ethyl acetate eluent, test a modestly higher ethyl acetate fraction on a new plate. Change one variable at a time. If the spot remains stuck despite sensible solvent adjustments, reconsider your TLC system and sample chemistry.
3. The spots run with the solvent front (Rf ≈ 1)
What you observe: Spots cluster near the very top, or two compounds merge into one high-migrating band.
Why it can happen: On a normal-phase silica plate, an overly strong eluent can carry the analytes nearly as fast as the mobile phase. Their migration becomes difficult to distinguish. A high Rf is not automatically evidence of an impure compound; it usually tells you that the current chromatography conditions are not informative enough. [1] [5]
Lower the strength of the mobile phase. In a common hexanes/ethyl acetate system, that often means decreasing the ethyl acetate fraction. Repeat with the same plate type and a new, properly spotted sample.
Practical target: Many teaching laboratories prefer intermediate Rf values when comparing compounds, but there is no universal “perfect” number. What matters is getting measurable, reproducible separation for the analytical question.
4. The spots were submerged in the developing solvent
What you observe: The original spot dissolves into the solvent pool, washes off the plate, or produces a distorted starting band before proper chromatography begins.
Why it happens: The sample baseline was placed below the solvent surface. Instead of the mobile phase moving past a fixed starting zone, the deposited sample can dissolve directly into the reservoir. This is a setup error, not a chemical measurement you can correct with a mathematical adjustment. [4] [5]
Lower the mobile-phase depth. Draw the baseline lightly in pencil, typically roughly 1 cm above the plate’s lower edge, and make certain that the liquid in the chamber stays below the spotting line. Follow your laboratory’s specified plate and chamber dimensions.
5. The solvent front is crooked or uneven
What you observe: One edge of the solvent front has moved farther than the other, or adjacent lanes appear to have migrated under different conditions.
Why it can happen: A tilted plate, an unevenly placed solvent pool, splashing, touching the stationary-phase surface, or moving the chamber during development can distort solvent motion. Consistent chamber saturation with solvent vapor also helps make development reproducible. [2] [4]
Use a level, covered chamber and a properly positioned vertical plate. Avoid touching or disturbing the chamber while it runs. If the front is substantially distorted, rerun the sample; measuring a different solvent-front distance in each lane may be a defensible record for a mildly uneven front, but it does not repair poor chromatography.
Important detail: If you repeat the experiment, preserve the original plate sketch rather than silently replacing the observed result. Describe what was changed and whether the separation improved.
6. The solvent front was not marked—or the Rf distance was measured incorrectly
What you observe: Students report Rf values greater than 1, measure from the bottom of the plate instead of the pencil baseline, or cannot locate the solvent front after the plate dries.
Why it happens: The mobile phase evaporates quickly after removing the plate. Rf requires two distances that share the same zero point: the initial baseline. The spot distance is measured to the center of the separated spot, not necessarily its uppermost edge. The resulting ratio has no units. [1]
Remove the plate when the solvent front is near—but not at—the top. Mark the front immediately with pencil. Once the plate has dried, circle the spots and measure their centers from the original baseline. If the solvent front was never recorded, do not invent its location: repeat the TLC for a trustworthy measurement.
Worked example: how to calculate Rf correctly
Suppose a spot center traveled 2.5 cm from the pencil baseline. The solvent front traveled 5.0 cm from that same baseline.
Rf = (2.5 cm) / (5.0 cm) = 0.50
This means that, under these conditions, the compound migrated halfway as far as the solvent front. It does not mean the sample is 50% pure or that the experiment gave 50% yield. [1]
7. Nothing appears on the TLC plate
What you observe: The plate looks blank after development, or the sample is visible in one visualization method but not another.
Why it can happen: Many organic compounds are colorless. Fluorescent indicator plates such as silica gel F254 often allow UV-active compounds to appear as dark spots under suitable UV light, but not every compound absorbs strongly at the excitation wavelength. A sample may also be below the detection limit or have been lost through poor spotting or unsuitable solvent conditions. [5]
Confirm that a standard or known sample gives a visible signal using the same plate and viewing method. Use approved, compatible visualization methods (UV, iodine chamber, or an appropriate stain) as directed by the instructor and the laboratory’s safety procedures. Mark temporary spots when they are visible.
Safety reminder: UV radiation can injure eyes and skin, and many TLC stains/solvents have important chemical hazards. Use shielding, appropriate PPE, functioning ventilation, and approved procedures. Never look directly at a UV source or improvise staining reagents.
A better five-step TLC workflow
- Plan: Choose the stationary phase, mobile phase, samples, and reference lane; record solvent composition by volume or ratio.
- Spot: Draw a pencil baseline above the chamber solvent depth; deposit small spots and dry them before development.
- Develop: Cover the chamber and allow the solvent to rise without moving the setup; stop before the front reaches the upper edge.
- Record: Pencil-mark the solvent front immediately; reveal the compounds safely; outline the spots and sketch all visible lanes, including faint bands.
- Interpret and improve: Calculate Rf values from the baseline, compare standards and sample lanes, and rerun after changing only one troubleshooting variable. [2] [6]
Bench-level takeaway: A dependable TLC record should identify the plate type, solvent ratio, reference standards, baseline/front positions, spot colors or visualization method, every observed spot, and the conditions of any repeat run. A result becomes scientifically useful when another chemist can reproduce your interpretation.
Bonus: When your reactant and product have nearly identical Rf values
Two compounds can produce spots that overlap in one solvent system. A single visible spot does not prove they are identical, and a TLC plate alone generally cannot establish purity with high confidence. Compare authentic reference lanes, use a co-spot to test whether two components resolve, try a different solvent mixture, or confirm with an independent method such as IR, NMR, or GC where appropriate. The University of Rochester specifically recommends co-spotting and solvent changes for compounds with similar Rf values. [3]
TLC troubleshooting FAQ
Why are my TLC spots streaking?
Sample overloading is a common cause, especially if the spotting solution is concentrated or a large wet spot is applied. Start by diluting and drying the sample properly. Persistent streaking can also reflect the spotting solvent, strong adsorption, or chemical instability.
Why is my TLC Rf value too low?
On normal-phase silica, the compound may interact strongly with the stationary phase and the current mobile phase may be too weak. Increasing eluent strength—often by using a higher proportion of a more polar solvent—can increase migration, provided the compound remains stable.
Why are my spots at the top of the TLC plate?
The mobile phase may be too strong for the analytes on that stationary phase. Reducing eluent strength commonly lowers Rf and can improve the separation.
Can two compounds have the same Rf?
Yes. Equal or similar Rf values under one set of conditions are not proof that two substances are the same. Use standards, co-spots, a different eluent, or orthogonal analysis when identification matters.
Does an Rf of 0.50 mean the product is 50% pure?
No. Rf is a ratio of traveled distances, not a percent purity, percent yield, or composition measurement.
What if I forgot to mark the solvent front?
For an accurate numerical Rf, repeat the run and mark the front promptly. Do not estimate an evaporated solvent front as though it were measured.
Continue learning chromatography with IntoChemistry
References and further reading
All diagrams above are original IntoChemistry schematic illustrations created for this article. They are educational examples, not photographs of measured samples. The featured cover artwork is likewise original editorial artwork. Technical recommendations are informed by these educational and university laboratory resources:
- Lisa Nichols, Organic Chemistry Lab Techniques, “The Retention Factor.” Chemistry LibreTexts.
- Lisa Nichols, Organic Chemistry Lab Techniques, “Step-by-Step Procedures for Thin Layer Chromatography.” Chemistry LibreTexts.
- University of Rochester, Not Voodoo: “Troubleshooting Thin-Layer Chromatography.”
- Columbia University, chemistry laboratory instructions on developing-chamber setup and visualization.
- Chemistry LibreTexts, “Thin Layer Chromatography” (organic laboratory experiment and practical Rf limitations).
- Chemistry LibreTexts, Triton College Organic Chemistry Laboratory, “Thin-Layer Chromatography — Data and Report.”
IntoChemistry · Organic Chemistry Lab Skills · Updated November 7, 2026. This article supports supervised chemistry education. Follow your institution’s safety policies and chemical-specific risk assessment before performing chromatography. No external third-party photographs were reproduced.